I was very pleased with the reception I got at Seattle Pacific regarding the themes in my forthcoming book. In addition, I’m starting to see blurbs from reviewers and I have a meeting with the marketing team on Tuesday. This thing is really happening!
A couple of weeks ago I wrote that I was reading Melissa Deckman’s The Politics of Gen Z: How the Youngest Voters Will Shape Our Democracy. I’m still only a few chapters in, but there are important patterns that are potentially important for the outcome of the 2024 presidential election.
Yesterday, the New York Times/Sienna poll released its latest data based on 2,437 respondents with an oversample in Pennsylvania with data collected from September 11 to 16. The top line number that got politicos talking was that the race was essentially tied with 46% supporting Harris and 46% supporting Trump. Nerd that I am, I dug into the crosstabs.
When one looks at subgroups, you see some familiar patterns. Males favor Trump by 52-39% and females favor Harris by 53-41%. When it comes to age, 18-29 year olds favor Harris 58-37%, 30-44: Harris by 49-45%, 45-64: Trump by 49-47%, and 65 and over favor Trump by 51-44%. These subgroup comparisons are interesting and suggest strategies the campaigns can use to either hold their base or increase their reach.
The challenge in making sense of this data lies in the relative sizes of the subgroups. The pollsters weight the data based on its imagined share of the total electorate. This is a tricky business because how you do the weighting is an art and not a science (more below). With regard to age, they estimate that the 18-29 block makes up 12% of the electorate. The 30-44 block is 22%, 45-64 is 33%, and 65 and over 28%.
Nerd that I am, I created an Excel table that first multiplied the 2,437 respondents by the percentages in the previous paragraph. Then I multiplied those subgroups by the percentage breakdowns in the paragraph before it. When I added them all together, I came up with 1125 for Harris and 1101 for Trump (46.2% to 45.2%).
When I looked at gender, women made up 53.3% of the population and men 46.7% (the gender total is only 2405). When you take those subgroups and multiply them by the gaps above, you get 46.5% for Harris and 46.1% for Trump.
So obviously this is a very tight race. At least based on what we think we know. If the demographic makeup of the electorate looks like it has in prior cycles, the assumptions in the suggest a tight race in the swing states decided by a relatively small number of votes.
But what if the makeup of the electorate is different that what we expect? What is the likelihood that the youngest sector of the generation remains at 12% of the electorate? We can ask about past patterns of behavior for the older sectors by exploring their voting propensity. But the number of new voters registering and voting for the first time is only a guess. We have data on surges of registrations among younger populations. After Taylor Swift’s endorsement of Harris, the New York Times reported on a change in voter registration patterns.
Celina Stewart, the chief executive of the League of Women Voters, which runs Vote411.org, said that as of Thursday morning, the number of people using its voter registration tools had more than doubled since Tuesday — and the people who visited were on average younger than the site’s typical visitors.
On Monday, Ms. Stewart said, the age group that had the most visitors to Vote411.org was 55 to 65. On Wednesday and into Thursday morning, it was 18 to 24.
If 18-29 year olds vote in this election at greater than historic patterns, Harris’s margin goes up considerably. If a larger share of the electorate is female, the same thing happens.
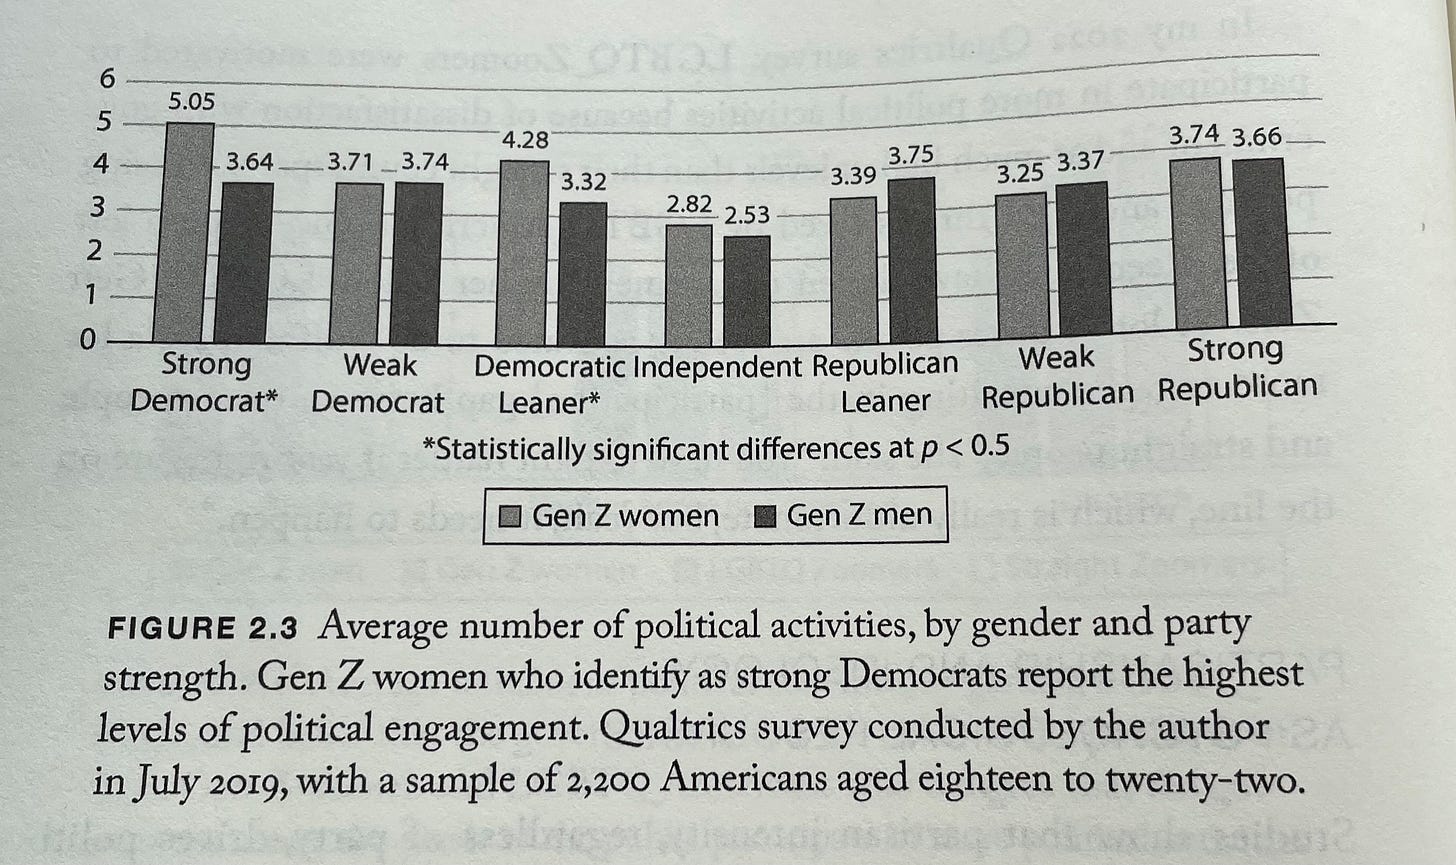
Melissa Deckman’s book provides a glimpse of how this shift could take place. In her research, she tracked a gendered difference that interacts with partisan identification.
The Y axis is a measure of the number of political activities her respondents engaged in political activities. She explored the likelihood of nine active politics measures (e/g/, attending meeting, giving money, campaigning) and eight passive measures (e.g., talking to family, friends, social media). Note that the two highest levels of engagement were found among Gen Z women who were strong Democrats or leaned Democratic. There is not a lot of variation across the other segments with the exception of independents who are less engaged regardless of gender.
She explores the gender distinction in a later chapter and I plan to come back to that question (as well as the podcast bro culture) later next week. For now, her data from 2019 suggests that the level of advocacy among young Democratic activists will be increasing as we move forward. I would just end by noting that her 18-22 year olds are now 23 to 27 and make up the heart of the youngest subgroup in the New York Times/Sienna crosstabs.
The anecdotal data suggests that this population of young women is motivated around this election in ways that hasn’t been true in the past. With abortion and misogyny on the ballot, I expect this anecdotal data to be confirmed by actual election results.


