Hardly a day goes by without the media telling us that voters are concerned about crime, worries second only to inflation and the price of gas (which is going down). Just yesterday, NPR reported that former president Trump said “"Our country is now a cesspool of crime … We have blood, death and suffering on a scale once unthinkable because of the Democrat Party's effort to destroy and dismantle law enforcement all throughout America." These concerns regularly show up in opinion surveys as people worry about crime, whether rampant or not. In 2020, Gallup reported that more Americans thought crime was going up than have since the 1990s.
Here is the chart from the Gallup story. The bottom line is interesting (especially the gap between the two lines) but I’m focused on the top line.
The report shows that 78% of respondents thought that crime was getting worse compared to 89% in 1993. But a look at the chart shows that by 1996, the figure was only 71%.
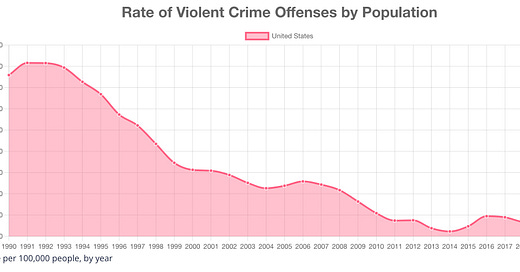
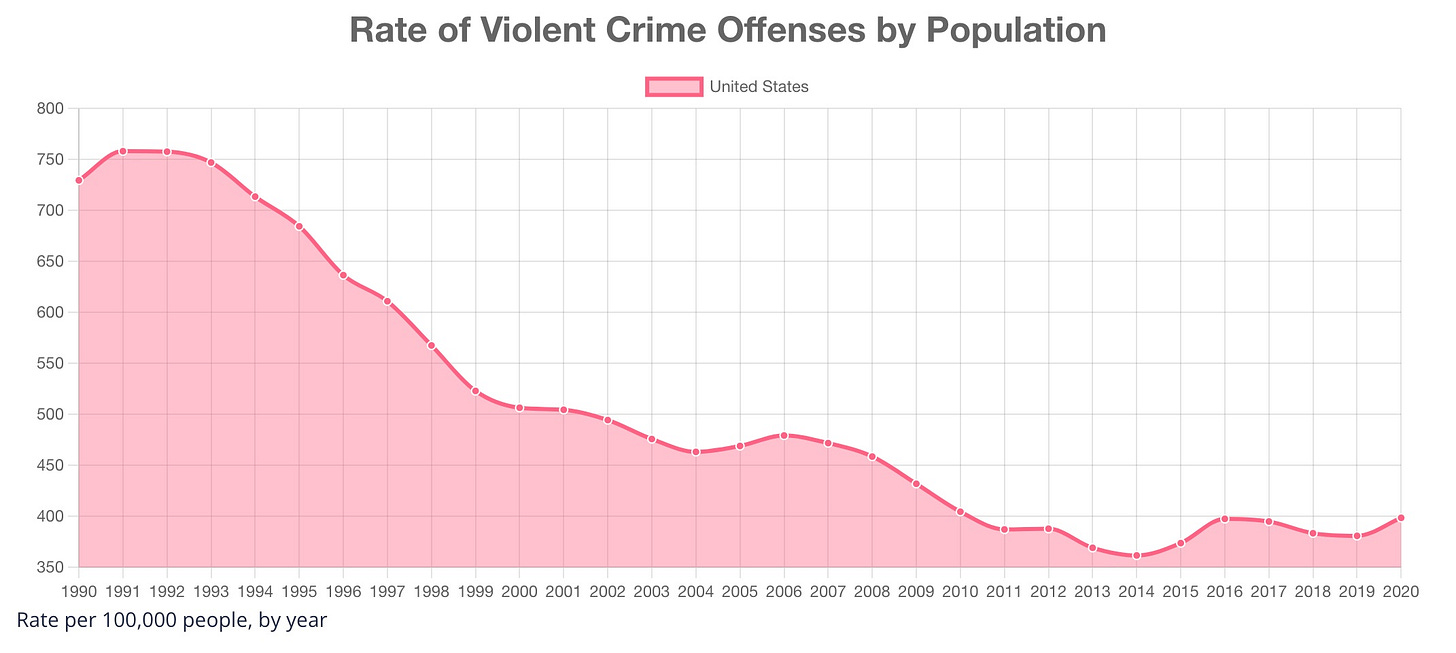
Here is a thirty-year look at Violent Crime rates from the FBI:1
The FBI data always corrects incident reports (actual crimes) into crime rates. Basically, you divide the population figure by 100,000 and then divide the incident count by that figure. If a town of 200,000 people had 24 violent crimes, you’d divide the 24 by 2 and have a crime rate of 12.0
The US violent crime rate peaked in 1992 at just under 778 violent crimes per 100,000 population. The figure for 2020 (the last FBI data available) is 398.5, which is up from 380 in 2019.
The gap between these two charts is telling. From 2003 on, the majority of the public believed that crime was increasing year over year. While there is a minor increase between 2005 to 2007, it’s a steady story of general decline through 2014. Part of the answer for this mismatch is the constant stories (real and fictional) about crime across the country. The actual data tells a very different tale.
These data are gathered from law enforcement agencies across the country. The agencies voluntarily report their data, which is compiled at the state level and forwarded to the FBI. In 2020, 85% of agencies submitted data. Here’s how the FBI describes the process:
Submitting UCR data to the FBI is a collective effort on the part of city, university/college, county, state, tribal, and federal law enforcement agencies to present a nationwide view of crime. Participating agencies throughout the country voluntarily provide reports on crimes known to the police and on persons arrested. For the most part, agencies submit monthly crime reports, using uniform offense definitions, to a centralized repository within their state. The state UCR Program then forwards the data to the FBI’s UCR Program. Agencies in states that do not have a state UCR Program submit their data directly to the FBI. Staff members review the information for accuracy and reasonableness.
Three things are worth highlighting here. First, these are crimes known to the police. That means that there are crimes not known.2 Second, it stops its analysis at knowledge of the offense. Clearance, or arrest, is an additional step. Third, these are offenses not individual actions. One crime might include robbery and a gun violation. Those are counted as separate events.
One way of understanding the FBI chart above is to think about the relationship of offenses to the growth of the population. Even if offenses go up but do so as the population is growing at a faster clip, the rate will go down.
By the way, here is data relative to the subtitle above. It is common for politicians and law enforcement types to point at Chicago and say, “why doesn’t somebody do something?”. When you control for population size, you find that Chicago had a homicide rate of 18 per 100,000. That’s bad, for sure. But if you do the same analysis for all reporting municipalities in Illinois, Chicago comes in 21st. On aggravated assault, they finish 30th.3
Here’s the thirty-year chart on property crimes:
This shows a straight decline over time with the exception of the 2000-2001 change4. If you think about it, this isn’t surprising. We’ve made tremendous advances in home security systems, CCTV cameras at businesses, car alarms and the like. We’ve take a great number of steps to make this progress.5
I’m not sure that voters are thinking about property crime when they say that crime is a big issue. Former president Trump sure didn’t sound like he was worried about rates of arson or burglary. And it is true that we’ve seen an uptick in recent years in acts of violence.
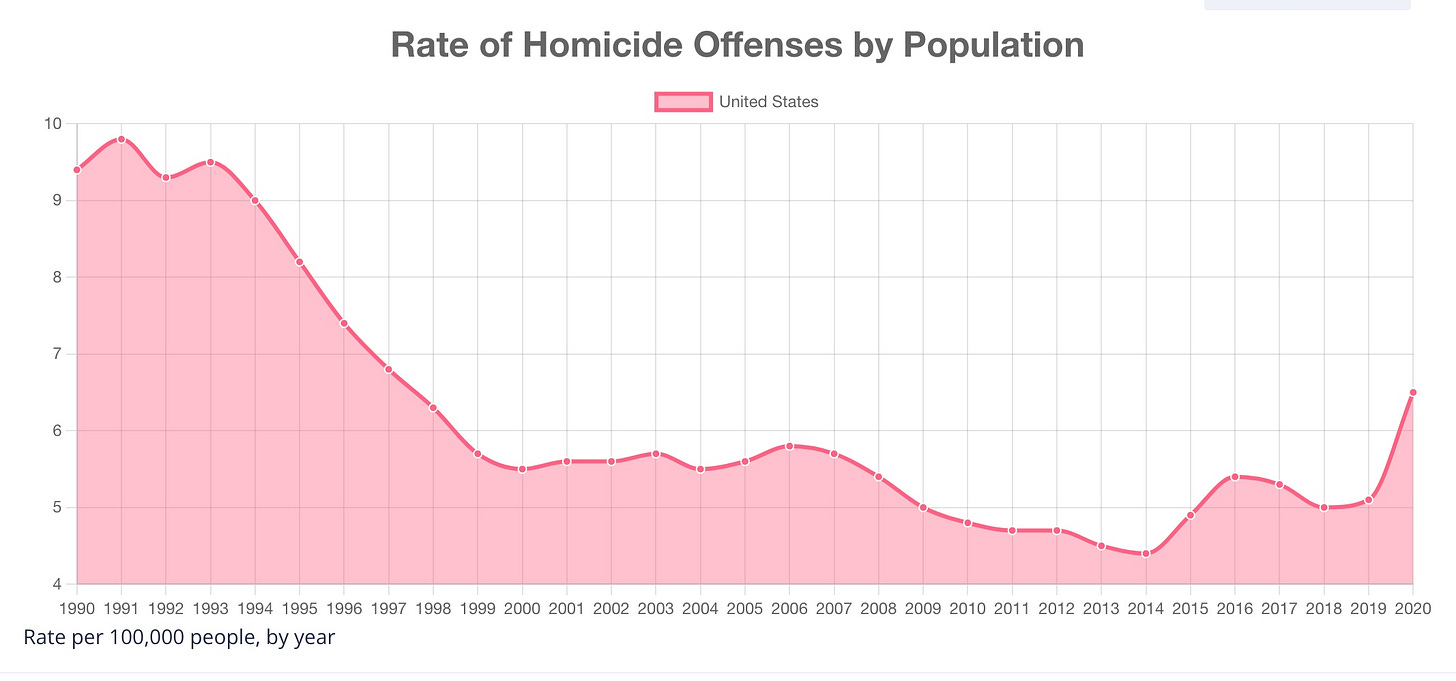
This is the FBI data on homicides over time:
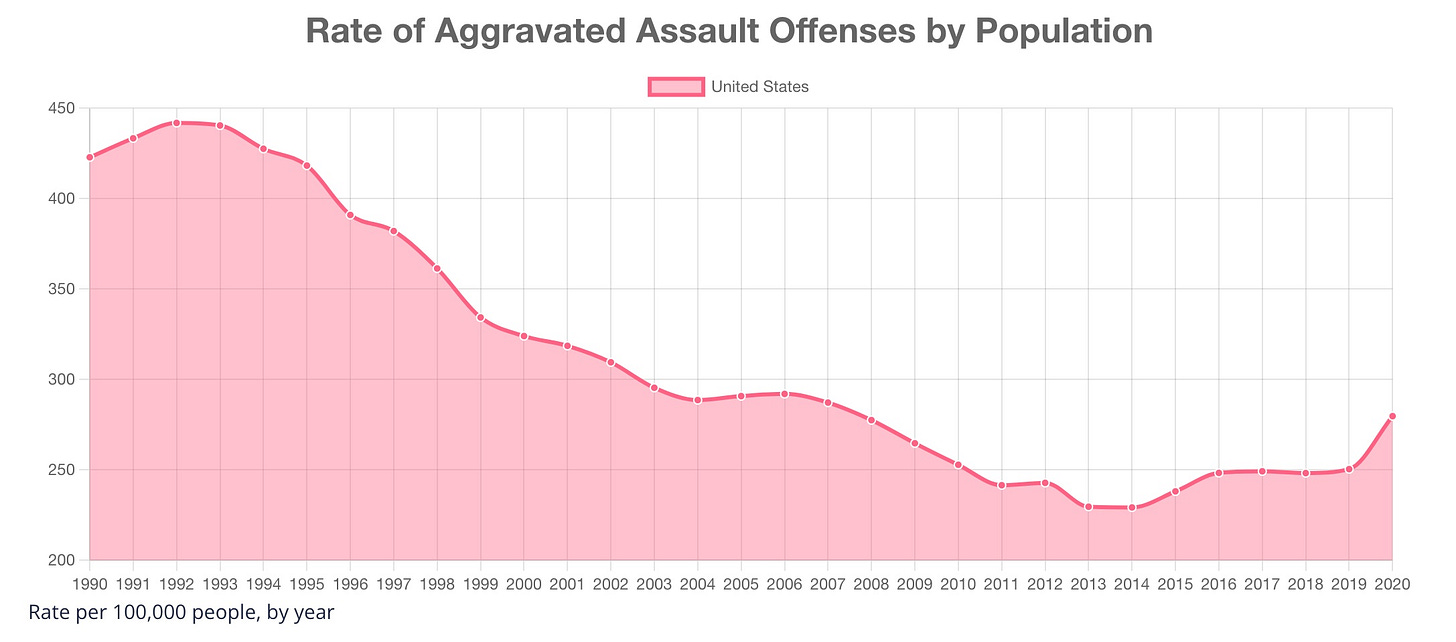
And here’s the data on aggravated assault:
Both charts have seen an increase since 2014. For homicide we went from a homicide rate of 4.0 in that year to 6.5 in 2020. That’s 2.5 more homicides per 100,000 people.6 A report from the Council on Criminal Justice made an estimate of 2021 data, showing a 5% increase in homicides over 2020. If that holds, it suggests a slowing of the growth curve above.
How do we understand the uptick in these violent crimes? It’s not just a partisan matter, as rates are up in both Democratic and Republican controlled cities. It’s clearly not about cash-bail policies as these tend to deal with misdemeanors and not felonies.
Last year, reporters for the Washington Post explored a number of options. They summarized their thoughts as follows:
Ultimately, the evidence doesn’t paint a simple picture of why homicide rates surged in 2020. The rise in violence during the pandemic appears to be a problem that is uniquely American, so broad explanations that emphasize economic strife, social stresses and disruptions to public services are, at best, incomplete. The evidence suggests that gun-carrying increased sharply shortly after pandemic-induced lockdowns began, either because police withdrew from public spaces or because people expected an arms race in communities suffering from endemic violence. The summer protests reignited a long-brewing legitimacy crisis for law enforcement and may have made it more difficult for police to reassert control over spiraling violence and retaliation.
Forbes reported that people in the US bought 19.9 million guns in 2021, second only to the record set in 2020 (22.8 million). I realize that this will step on some Second Amendment toes, and I’m not suggesting any immediate changes in law. But if what in the past was seen as an increase in road rage or a general belligerence toward others is now accompanied by people carrying weapons in public spaces, it’s a short step to aggravated assault or homicide. I’m not talking here about the mass shootings that dominate our attention. Rather, we see the neighborhood bar fights that involve people drawing weapons resulting in aggravated assault or homicide.
I wish I was more optimistic about the possibility of our violent crime rate as it did between 2010 and 2014. Perhaps we’ll come out of our current economic and social capital slump better able to get along with our neighbors. But I don’t see the characteristics that would lead to that improvement anywhere on the horizon.
The best hope I can offer is for people to stay away from volatile spaces. Don’t stay at the bar until the 2 AM closing. Don’t hang around parks in the wee hours of the night. Don’t pick needless fights with the guy who cut you off in traffic. Perhaps some collective wisdom can lead us to a better place.
For most of its history, the FBI has reported out its annual data is the Uniform Crime Report. What I found for 2020 is a new, very interesting website which allows all kinds of exploration for data nerds. The link above the Violent Crime chart takes you to the “crime data explorer” app. It’s really cool and is how I made all the FBI charts.
I’ll explore in another newsletter how a police department’s strategy of personnel deployment impacts “crimes known to the police”
The winners are East St. Louis with a homicide rate of 137 (36 murders in a town of under 25,000) and Sauk Village with an aggravated assault rate of 4748 (490 aggravated assaults in a town of just over 10,000).
One deviation from the general trend is a recent slight increase in motor vehicle thefts since 2019, in spite of car alarms and electronic locks.
Of course, if your home was recently burgled, knowing that you’re an outlier is of no comfort.
That’s a lot in a nation of 335 million. Increasing the homicide rate by 2.5 is over 8,000 more homicides.


You're doing some pretty amazing teaching sans classroom. I'm going to read the whole series before commenting again, but so far, through Episode 2, this is the best crime show I've watched. It's also the kind of informed challenge set, the right premises, that should be driving public discourse. Sadly, the sensationalism of mass media, as you rightly point out, has too strong a grip on the wheel.
Thank you John- this is data I'd never think to look up. Thank you for sharing it.
Former President Trump's comment at the top is unfortunate--he needs to see the data you shared.
What I find most tragic is: "people in the US bought 19.9 million guns in 2021." (That would be several billion dollars, perhaps even as high as 10 billion.)
Enough said by me. God bless!