
Perceptions of Mainline Congregations on Social Issues
Another day on PRRI's Clergy and Congregations Survey

I’m still fascinated by what’s contained in PRRI’s 2023 Mainline Clergy and Congregations study. While I wish they had a matching sample from the congregation’s perspective, they do have clergy perceptions of the congregation’s position and I spent much of yesterday and today digging into that part of the data.
First, I want to circle back to a comment Susan Brown made on Wednesday’s post. She said:
I am curious about the difference between moderately and extremely accepting, because I would hypothesize that here is where the action lies. How do pastors deal with conservative congregants who oppose discrimination but still feel uncomfortable with championing the rights of LGBTQ+ and other marginalized groups?
I had mentioned in that post that there seem to be a lot of “accepting” options. She’s likely right that there is a measurable gap between extremely/very and moderately accepting. We would need more data from the congregation’s perspective to sort that out — or even some way of exploring how the clergy were parsing the options.
Sandra’s question sent me down several rabbit holes. I tried to imagine what the most conservative case would be and analyzed the question by region, urban/suburban/rural location, church size, and denomination. While there are some minor variations (less supportive in the south more in the west) and separation by denomination (more for Episcopalians and less for ELCA) there were still nearly a third who selected the extremely or very accepting option. Location wasn’t particularly important.
There was another set of questions that allowed some interesting comparisons. In addition to asking how often the pastor spoke on important social issues, there were some matching questions on “how well the congregation is addressing” the same social issues. I need to underscore that both of these are clergy perspectives. But the relationship between frequency of addressing a topic and perceived congregational engagement is pretty consistent throughout. Here, for example, is a table contrasting frequency of speaking on LGBTQ+ issues and how the congregation is seen to be addressing the topic.
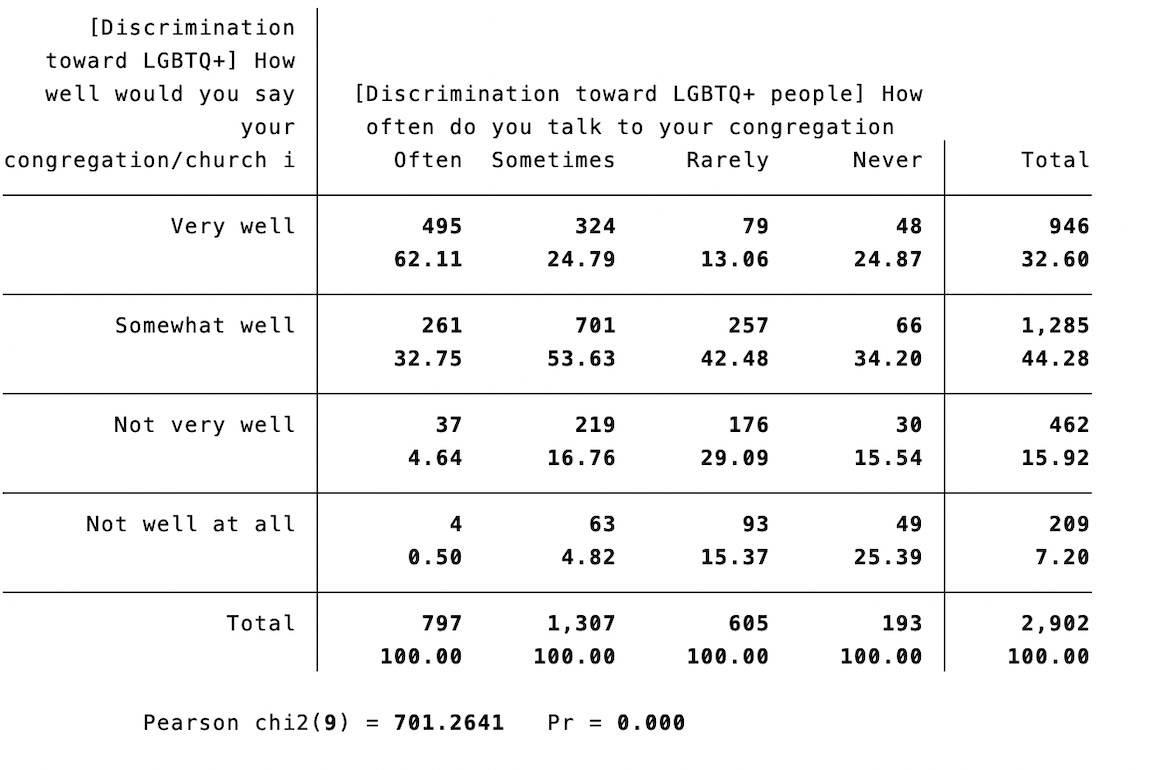
When I taught statistics and address the Chi Square test, I told students to pay attention to the diagonal. The more cases line up on the diagonal the more significant the relationship.1 The correlation between the two variables is a fairly healthy .423.2
This makes intuitive sense. The more the clergy person preaches on the topic (without crisis) the better the congregation adapts to the topic. The less the congregation is willing to address the topic, the riskier it is for the clergy to engage the topic.
Similar patterns were evident, although not quite as strong, for immigration and racial inequality. The Spearman’s Rho for those came in at .24.
While this isn’t definitive without exploring insights from the congregation, the data is consistent with my argument on Wednesday that mainline churches are not having social issues foisted upon them. They see them as natural points of engagement for people of faith. Again, the role of mainline (and Catholic) clergy in responding to ICE raids is telling.
One more thing. I’ve mentioned that a consistent evangelical critique of the mainline is that “they don’t believe anything”. I was pleased to see that PRRI is using a somewhat more nuanced (if wordy) question on what people believe about the Bible.
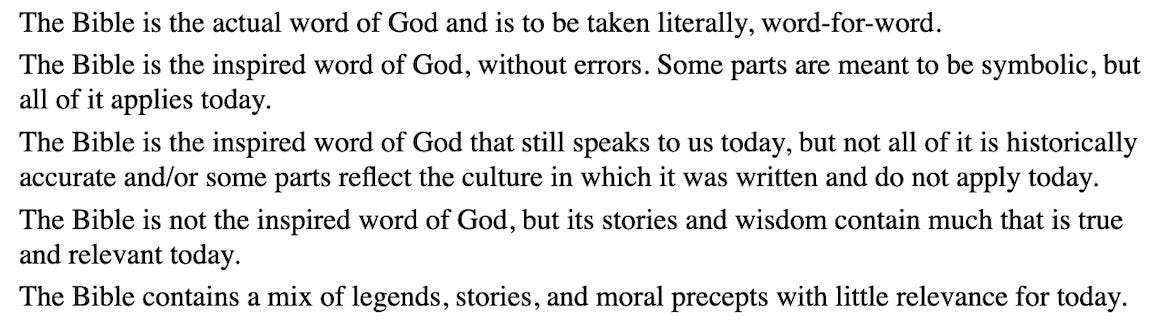
I like this question. The first option is the literalist position. The second I would consider inerrantist. The third affirms the inspiration of scripture but acknowledges that some elements are culturally bound. The fourth denies inspiration and the fifth denies the Bible. The clergy report their own position and then give their perception of where most of the congregation would fall.
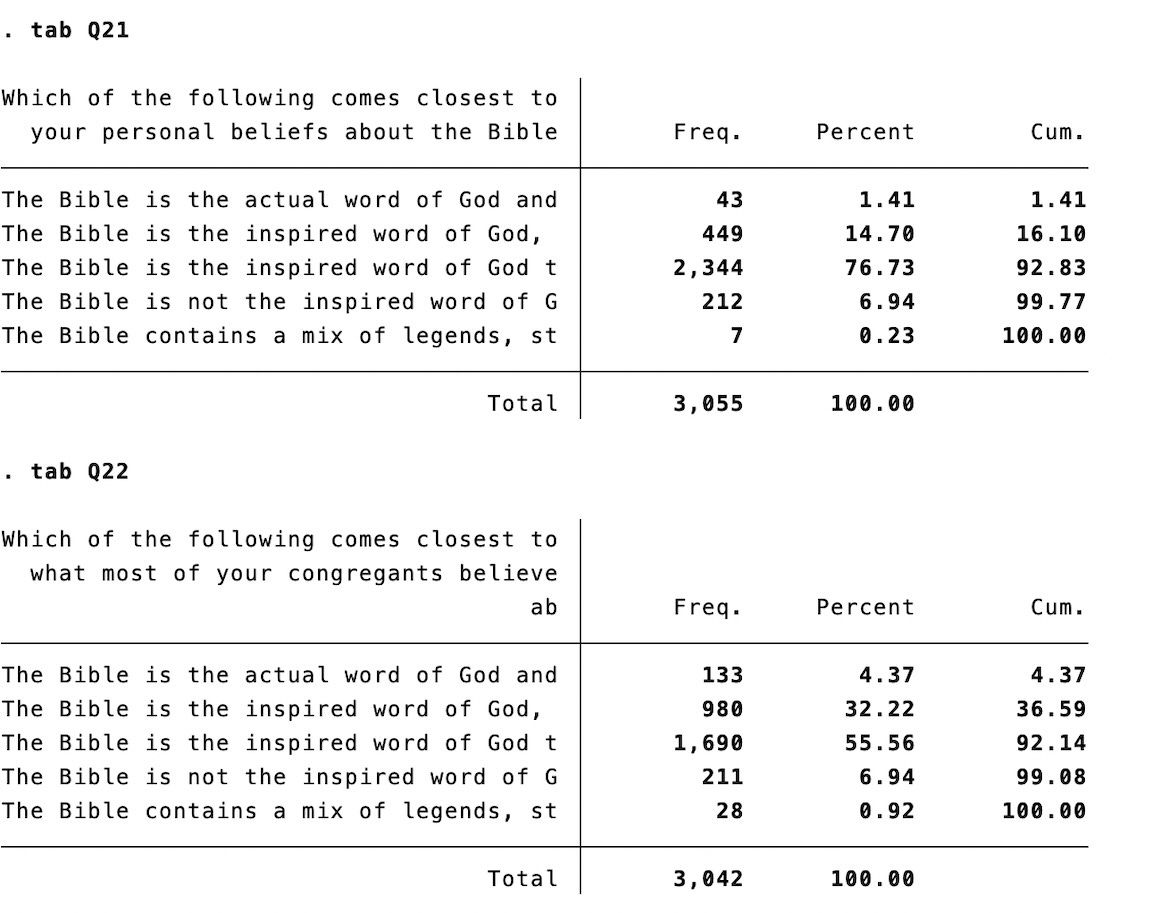
The majority of clergy and congregations fall in the third category. Congregants are over twice as likely to pick the inerrantist option. But less than 8% of either group selects the two most skeptical options.
This suggests that the majority of mainline clergy and congregations surveyed are trying to hew close to scripture and working to apply that understanding to major social issues. I find that to be very good news indeed.
The critical value for a significant relationship with 9 degrees of freedom is 19.023. So this is literally “off the chart”.
Using a Spearman’s Rho for ordinal data.
This data is fascinating. I wonder how many “evangelicals” would pick #3 about the Bible.
Keep this series going. Love your idea for a book!