


The Catalist Report on the 2024 Election
Troubling News for Democrats

I mentioned in Wednesday’s post that the Catalist report on the election dropped this week (but I misspelled their name). Rather than relying on exit polls, which are frequently helpful but not fully accurate, the Catalist folks examine actual voting records. This allows a demographic analysis based on identified personal characteristics, region, and past voting behaviors. Because it relies on the voting records, it doesn’t allow any examination of attitudinal factors that influenced whether one voted for Trump/Vance or Harris/Walz.
Many people are currently writing about how the Democratic messaging might need to change: more progressive, more centrist, more economics, more attacking the Republicans, more letting Republicans cause their own troubles. I like reading these analysts and find their writing insightful. Given the low favorability levels of the Democrats overall1, something needs to change.
The Catalist report cannot deal with those messaging issues. It is not clear how much of the 2024 results are due to message, policy initiatives, campaign strategy, or electoral infrastructure. Addressing the report will require focused attention on all of these areas in light of what we learn about the makeup of the electorate.
The report works through overall turnout (in both battleground and non-battleground states), race/ethnicity, education, gender, age cohort, urban/rural, and voting history. One consistent pattern emerges across much of the data. In 2020, Biden increased support across a number of factors and in 2024 support lagged to where it had been in the 2016 Clinton loss. In that light, it may be better to think of Biden’s 2020 victory as an anomaly.2
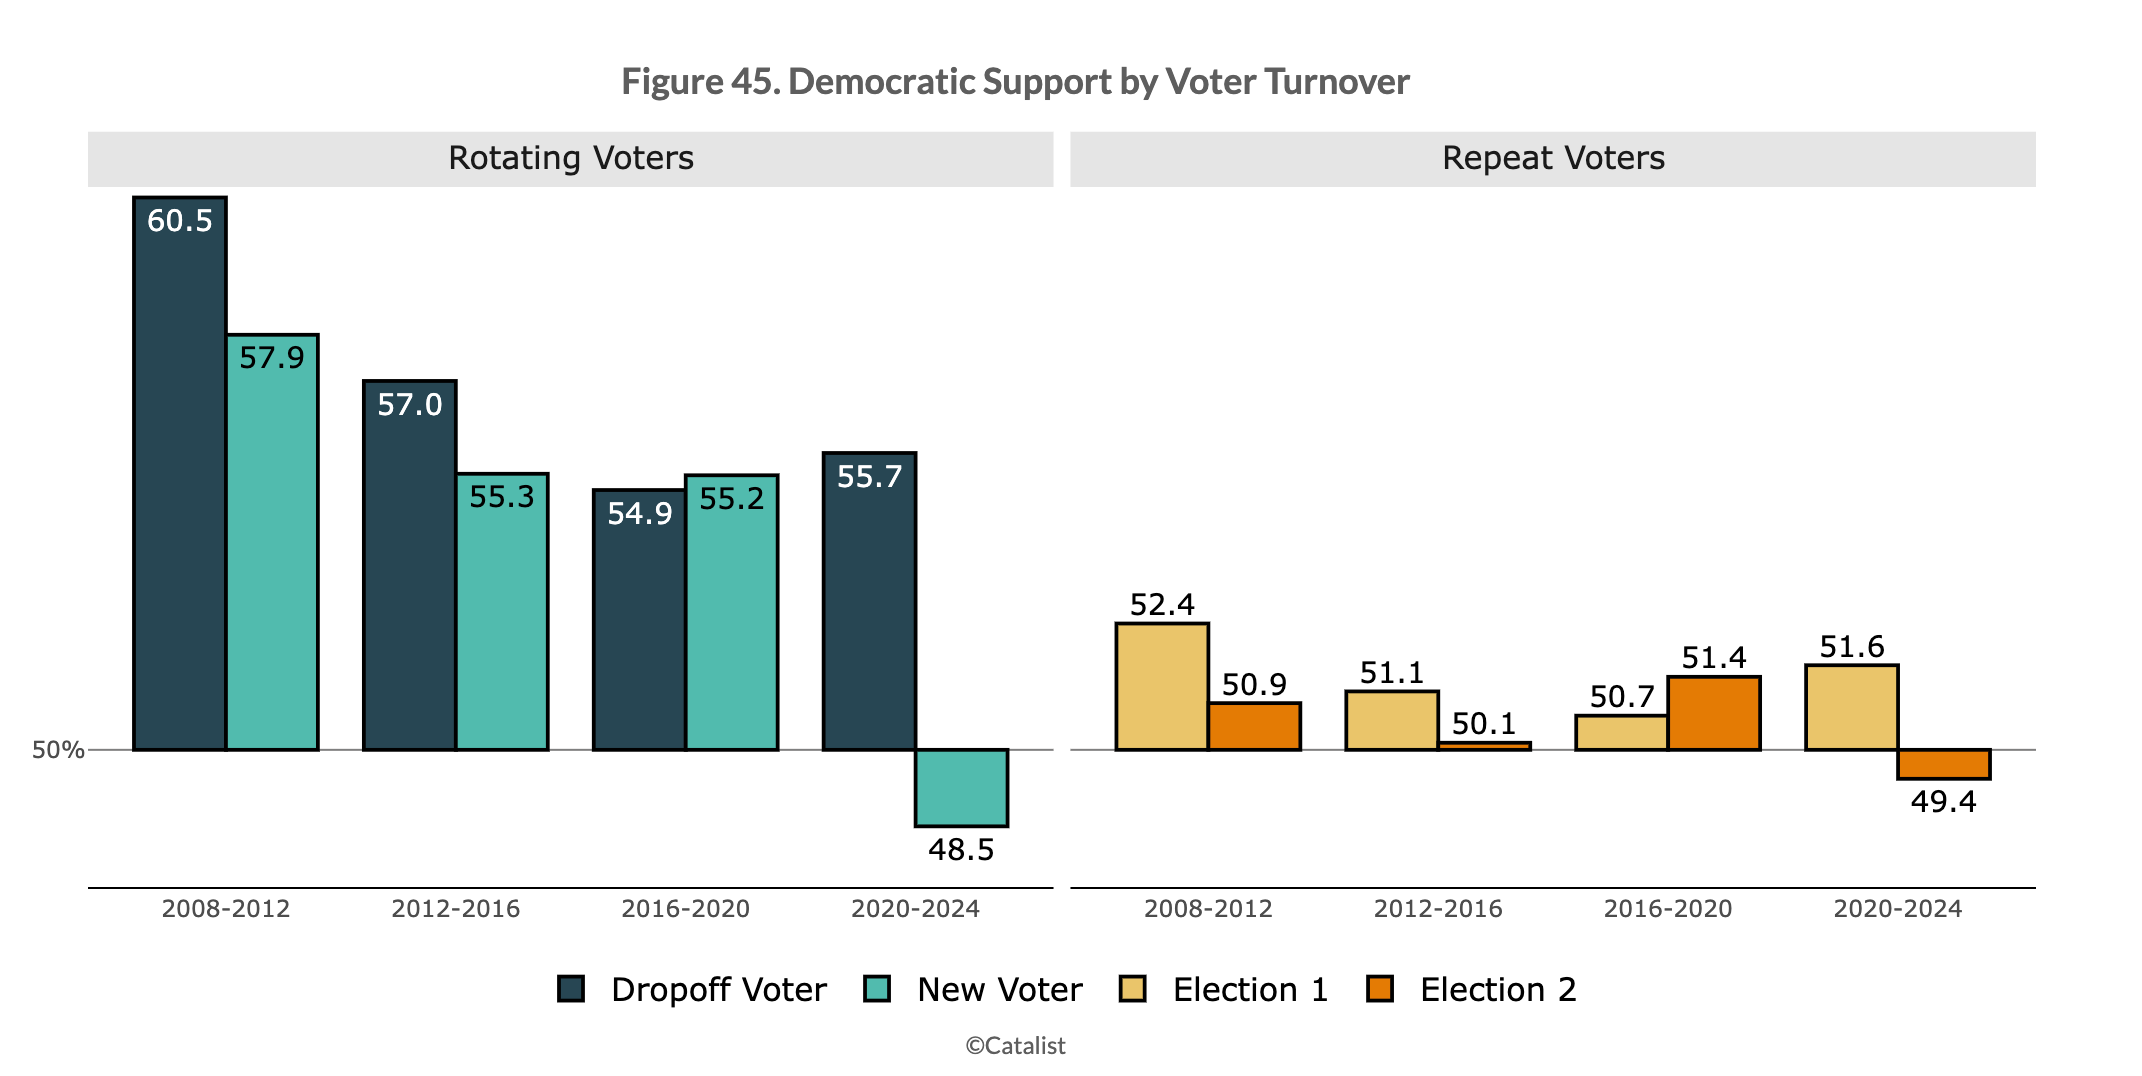
One chart rang alarm bells for me. Appearing toward the end of their report, it examined the change in the electorate over the past five presidential elections.

For each column, the chart identifies the number who voted in both elections (e.g., 2008 and 2012), those who didn’t vote in the first but did in the second (New), and those who did in the first and not in the second (Dropoff). While the growth in the overall electorate is significant (158M in 2012 to 182M in 2024), it is the comparison of the New and Dropoff voters that caught my attention. For Biden’s win in 2020, new voters exceeded dropoffs by nearly two to one. For the 2024 election, there were more dropoffs than new voters and the number of new voters dropped by 14 Million.
It has long been assumed that increasing the number of new voters worked to the advantage of Democrats. That pattern held until 2024. On the left side of the chart, the green bars tell the story. From 2012 to 2020, new voters voted for Democrats 55% to 45%. In 2024, new voters voted Republican 51.5% to 48.5%. I have to believe that the increase in dropoff voters made a huge difference.3
Relatedly, Millennial and GenZ support for Democrats fell between 2020 and 2024 both overall and in battleground states. While the majority of these cohorts supported Harris/Walz, they did so at 6% less overall and 4% less in battleground states.

The report explores the relative sizes of these various cohorts as follows:
In 2020, Gen Z voters began aging into the electorate in large numbers, comprising 8% of the national and battleground state electorates and growing to 12% in 2024 nationally and 13% in the battleground states. Millennial and Gen X voters fully aged into the electorate and are too young yet to age out in large numbers. Millennials represented 23% of both the national and battleground state electorates in 2020 and 25% in 2024. Gen X voters represented 26% of national and battleground state voters in both 2020 and 2024. Baby Boomers comprised 32% of voters in 2024, slowly declining from a presidential-year peak of 36% in 2016 as this cohort ages and exits the electorate.
When I multiply all this together, the Democratic support among Millennial and GenZ cohorts is only about 1.5 million votes above 2020. This was easily offset by the erosion among males in various ethnic backgrounds. For example, there is a remarkable drop (even if generally positive) in Democratic support among young Black men.

The drop is even greater among young Latino men. They dropped from over 60% Democratic in 2020 to only 47% in 2024.
These two charts should be shocking to party leaders. My supposition is that the failure to deal with economic realities and aspirations among young people is a significant factor. What it is not is dissatisfaction with the fact that Democrats don’t have a Joe Rogan type podcast!
One more chart repeats the same story of loss with respect to 2020. This looks at where the voter lived and then considers the share voting for the Democratic ticket.

While the historic connection between location and support for Democrats is evident here, a closer examination shows a loss in Democratic support across all of the battleground states. For urban areas, the support drops between 5% (Western) and 7% (Southeast). Suburbs lose as well but at slightly reduced levels (around 2-3%). The same thing happens in rural areas.
Before I end, it’s worth looking at the vote change over time among white voters. The short answer is that there isn’t any.

The major loss for the Democratic party was among young people of color. This is a considerable challenge for the prior models of voter turnout and motivation.
It’s certainly possible, maybe even likely, that the impacts of the Trump administration’s dismantling of government and draconian immigration actions, the One Big Beautiful Bill, and the tariff regime, will shift these dynamics for the 2026 midterms. It may still be a factor in the 2028 presidential election, especially if when Donald Trump isn’t on the ballot.
But those hoped-for victories will not change the erosion occurring within important segments of the historic Democratic coalition. And 2026 is too far away to simply hope things get better. The party needs to act now, if not yesterday.
The low approval is a combination of three factors: unified opposition from Republicans, frustration from existing Democrats, and general frustration with politics as it currently exists.
No, that’s not about vote dumps. It may reflect favorability toward White Men.
We’ll need the complete attitudinal analysis to determine how much the Uncommitted movement protesting Gaza is related to the results.
As always John, great stack, and thank you for illuminating the electoral data analysis. I had not heard of it before and intend to spend some quality time digesting it myself.