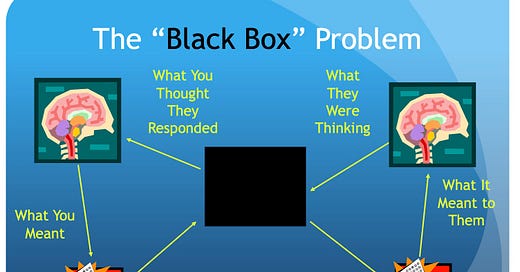
Over my years teaching sociological research methods, I always introduced the unit on survey research with a presentation on what I called the Black Box Problem. Here’s what the PowerPoint looked like1:
We start on the upper left with the concept that is central to the research question. The idea makes sense to the researcher, who then attempts to put the concept in a form appropriate for a survey. After appropriate pretesting and revision, the survey is administered (the first pass into the Black Box). The respondent gets the survey via paper, email, text, or interview. On the bottom right, the respondent reads/hears the question. Then the respondent thinks about how they should respond to the question. We hope that their response is an appropriate and meaningful answer to the question. After another pass through the Black Box, the researcher reviews and tabulates the response in light of the original concept being studied. The trick, I would tell my students, is to shrink the Black Box to as small as we can possibly get it.
This presentation came to mind last week because opinion polling was driving me crazy and I was griping about it on social media. I had seen news reports about public attitudes toward government spending. The stories highlighted the ways in which those attitudes don’t align with current stances from political leaders in Washington. The poll was conducted by the AP in consultation with the National Opinion Research Center at the University of Chicago. Looking up the topline survey showed this question at the center of the news stories:
Here’s what set me off on FaceBook and Twitter. The questions allow the respondents to evaluate what they thought of current levels of spending by category. But there is no information provided as to what the current levels of funding might be. For that matter, it’s not clear that all of the spending people might be thinking about happens at the federal level. And what does something as amorphous as “infrastructure” or “the military” include? And how are people to respond to federal spending levels for education and law enforcement when these are primarily local and not federal issues?
So there are huge Black Box problems here. The journalists reporting on the poll and the politicians reacting to the poll both assume this data tells them something meaningful about preferred policy preferences. It’s as if they assume that the respondents jumped on Google to find out the current spending levels and federal descriptions of these program areas and then made their rational judgment as to whether that amount was too little, too much, or just right (like Goldilocks).
As bad as the issue is with the budget poll, it looks positively scientific when contrasted with polling about the Trump Manhattan indictment. On Saturday, Maggie Haberman retweeted a Yahoo!News poll showing that the former president’s standing among Republicans increased over Ron Desantis following the indictment announcement. Trump went from being minus 4% in a head to head to plus 26%. This reflects a gain of Trump support by 16% and a corresponding loss by DeSantis of 14%.2 The story describes the research as follows:
The survey of 1,089 U.S. adults was conducted in the first 24 hours after a New York grand jury voted to indict Trump, as news about the case continued to break and sink in. For many respondents, the opinions expressed may be tentative and volatile — and some of the shifts evident in this immediate snapshot may be fleeting.
A survey asking people about the impact of the indictment within the first 24 hours is crazy! Sure, there’s cover in saying that respondent views might be “tentative and volatile”. What else could they be when nobody knows what’s in the indictment?
CNN followed this with their own polling. This one ran over two days (Friday and Saturday) and was collected as follows:
The CNN poll was conducted by SSRS on March 31 and April 1 among a random national sample of 1,048 adults surveyed by text message after being recruited using probability-based methods. Results for the full sample have a margin of sampling error of plus or minus 4.0 percentage points. It is larger for subgroups.
I should first note that last sentence because their story proceeds to dissect the data into numerous subgroups. Secondly, I’ve never done a text message survey even if it’s using “probablity-based methods” (whatever they mean by that).
Again, these are opinions from people who haven’t seen the indictment and how have little to no information of its potential political motivations, except what they’ve gotten from media reports.3 Their poll shows that Trump's favorability numbers didn't move much in light of the indictment, which suggests that some things were already baked in. But that reflects the guesses of people (like me) trying to make sense of the data.
Another point I’d make to my research methods students is that one of the primary advantages of survey research is that it’s relatively easy to do (relative to psychological experiments or qualitative research projects). It’s primary disadvantage is that it’s relatively easy to do.
Anybody can throw together a set of questions and get people to respond to them. The challenge is that you often have no idea what those responses actually mean.
I created this back when all we had access to was hokey clip art.
First, head to head national polls are worthless in advance of state level primaries nearly 12 months away. Second, DeSantis has had some bad news cycles in the last month. But rallying around Trump makes for a better storyline.
And the polling results are then used to verify past reporting and set the stage for the ongoing reportorial narrative.


